WALHT: write a survey using Google Form
Use the feedback to create and display that date in a pie graph.
Analyse the results.
What’s your favourite ice cream?
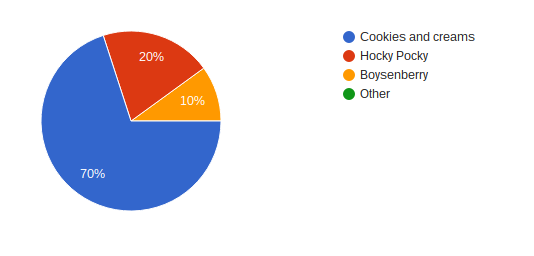
In this pie graph, it shows that 70% of the ten participants like cookies and cream. The second most chosen ice cream was Hokey Pokey and, the least popular ice cream with 10% of the votes chose boysenberry.
What’s your favourite fast food?
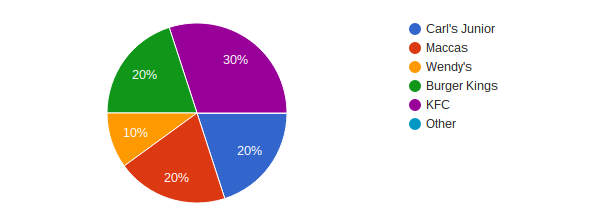
30% of the class prefer KFC when compared with food from the Wendy’s franchise which is their favourite.
What’s your favourite sport?

Kia Ora Launoa I really like the way you presented your diagrams. What sports would be in other?
ReplyDelete