WALHT: create graphs using a spreadsheet and to analyse data in those displays.
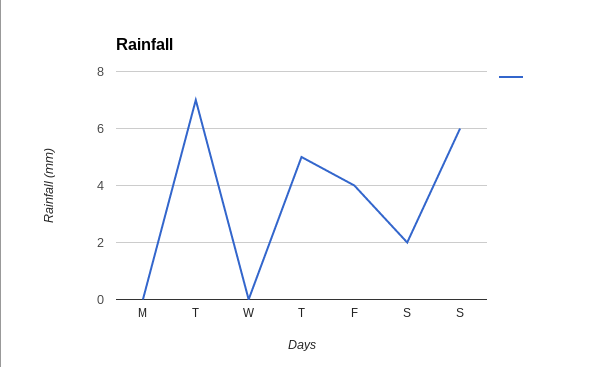
In this graph it clearly shows you the amount of rain there was in a week. On Tuesday and Sunday it rained a lot because of the amount it shows you.
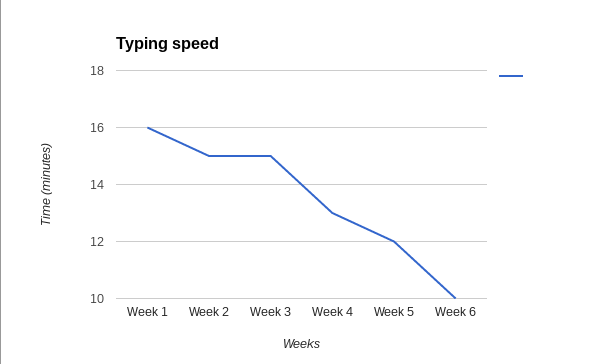
In this graph, it shows that in week 1 it took William 16 minutes to type 300 words. By the end of week 6 his speed had increased, he was able to type 300 words in 10 minutes.
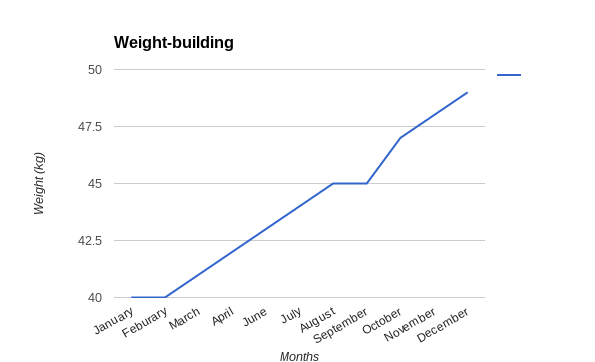
In this graph it shows us that this year the person began lifting weights of 40kg and by the end of the
year was lifting 49kg.
Well done Launoa, you are thinking about the task and the information it is giving you and then using this to summarize the displays.
ReplyDelete